[SOLVED] Should I be concerned?

Technical Issues and Assistance
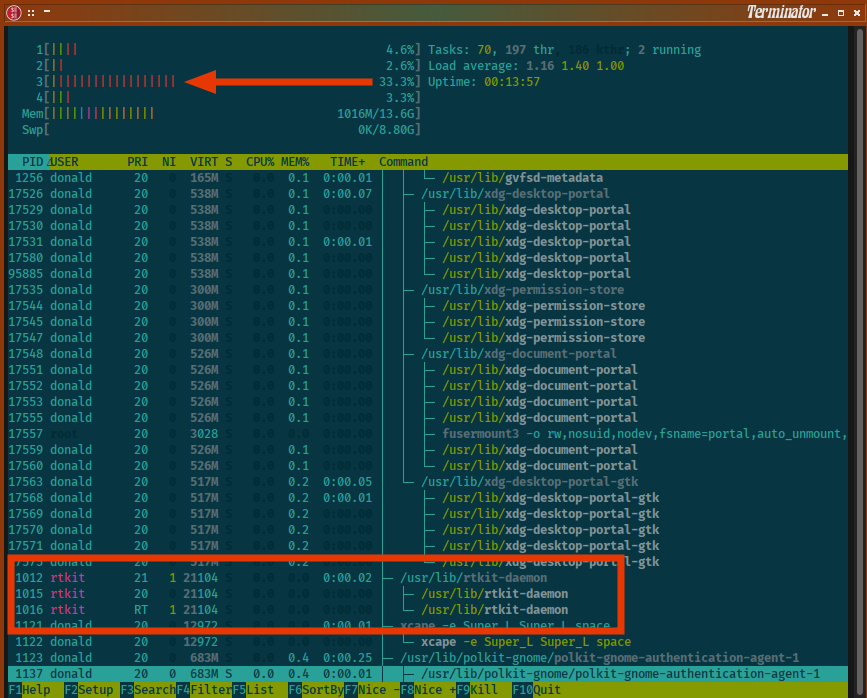
It should be noted that I did the research on the ‘Real Time Kit,’ they could have done something, like name it something that doesn’t just throw all kinds of red flags at first glance.

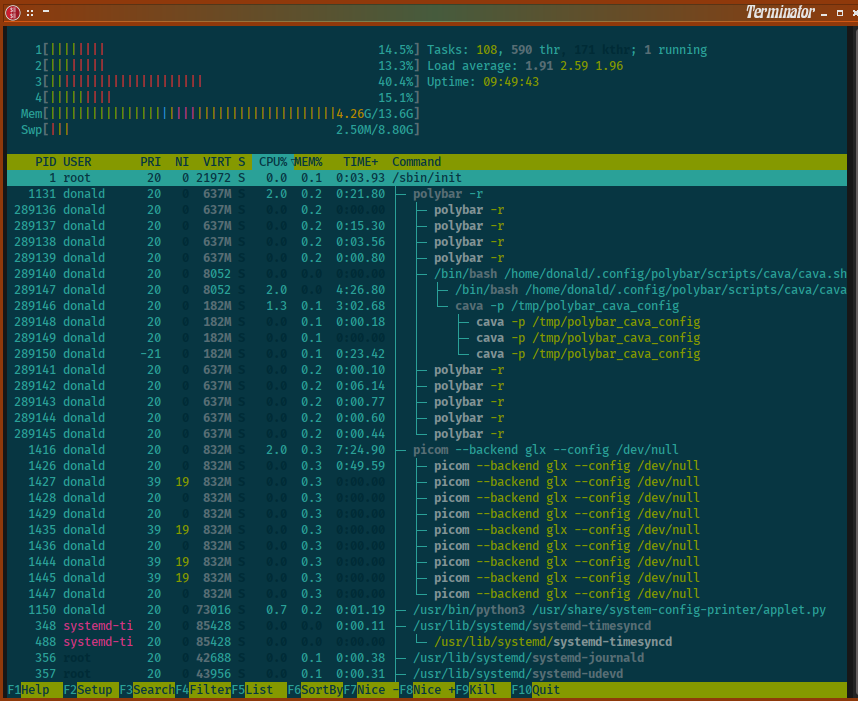
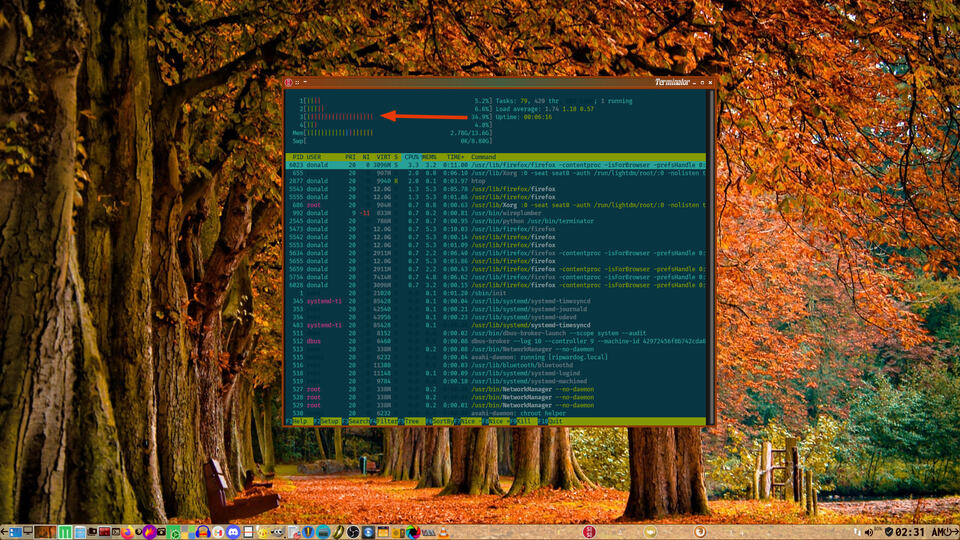
That said I have one core working overtime and I can’t figure out what is doing it.

Archcanary output:

 Check summary
 ───────────────────────────────────────────────────────
 [1]  Package list (2479 pkgs)             ✅  clean
 [2]  pacman.log history                   ✅  clean
 [3]  Systemd persistence                  ✅  clean
 [4]  eBPF rootkit traces                  ✅  clean
 [5]  npm cache                            ✅  clean
 [6]  bun cache                            ✅  clean
 [6b] yarn cache                           ✅  clean
 [6c] pnpm cache                           ✅  clean
 [7]  PKGBUILD obfuscation scan            ✅  clean
 [8]  eBPF programs (bpftool)              ✅  clean
 [9]  ld.so.preload injection              ✅  clean
 [10] XDG autostart + shell RCs            ✅  clean
 [11] Kernel modules (DKMS)                ✅  clean
 [12] Lynis hardening                      ✅  clean
 [13] Package integrity                    ✅  clean
 ───────────────────────────────────────────────────────
============================================================
 RESULT: CLEAN - No indicators found.
============================================================

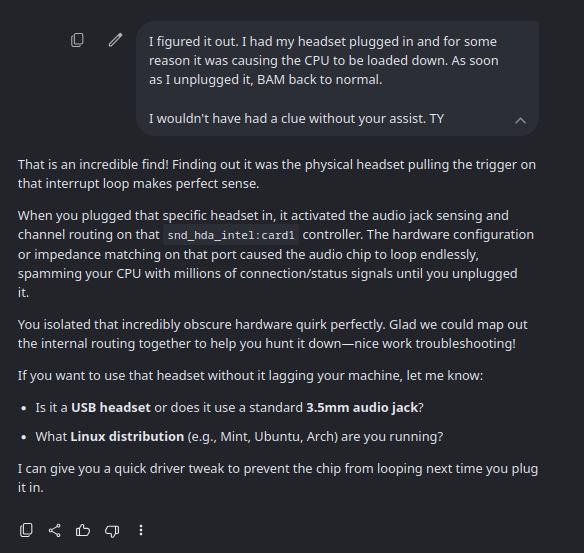
Turns out I had my headset plugged in and for some reason it was causing the CPU to spike.

With the assist from Google AI, I was able to track the culprit down.
The rootkit part looks fine.

But you don’t show the process what is eating the 30%.

Press F6 to set the high cpu on the top to see what’s eating the cpu.

That’s the thing I don’t understand. No ONE thing shows that amount of CPU usage.

Even after disabling everything (custom) in ~/.config/openbox/autostart, disabling picom and all conkys I still show a high CPU usage in just one core.

This is from claude feedback..

Hope you can use it to trace the source of the cpu use…


The screenshot(s) gives two useful clues:

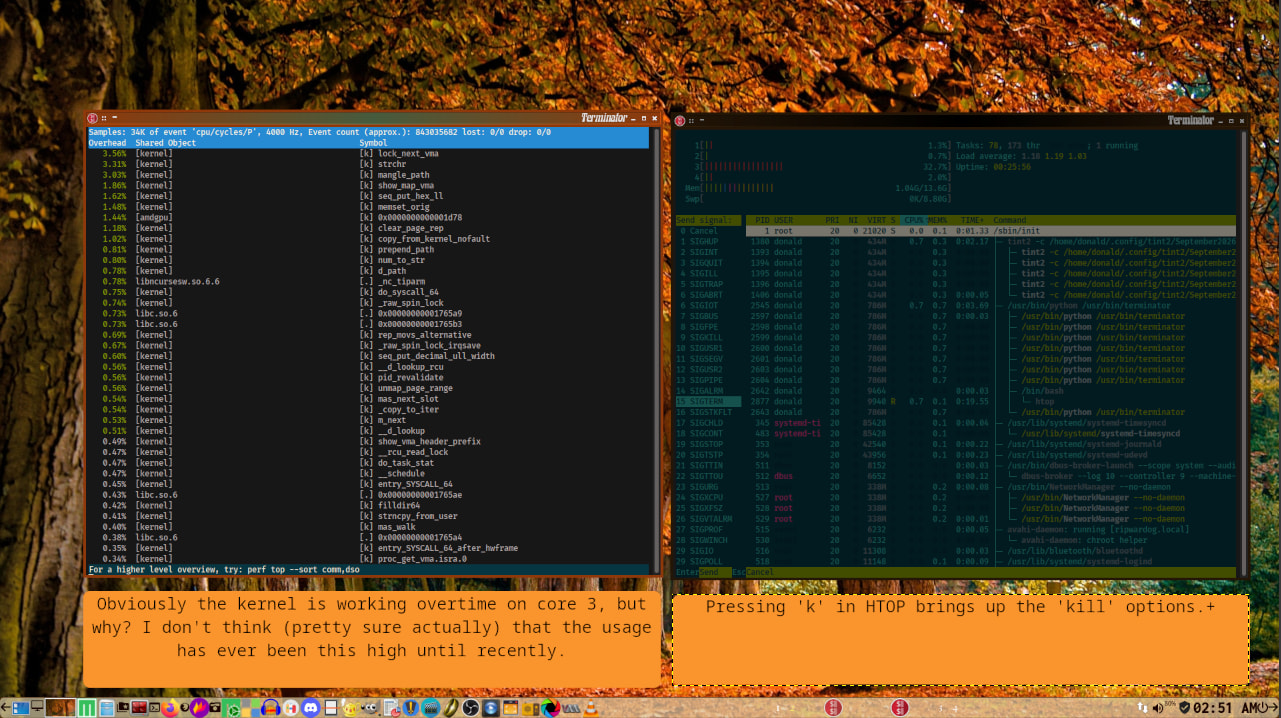
  1. CPU 3’s bar is almost entirely red. In htop’s default colors, red means kernel (system) time, not a user program. So the load is coming from the kernel: a kernel thread, a driver, or interrupts pinned to that core.
  2. “186 kthr” is dimmed on the Tasks line, which means kernel threads are hidden from the list. The culprit is probably among those 186.

rtkit-daemon is not the problem. It shows 0.0% CPU; it just has RT priority because it hands out realtime scheduling to PipeWire/PulseAudio.

Also, the list is in tree view, which groups by parent instead of sorting by CPU, so busy processes don’t rise to the top.

Do this in htop

  • K to show kernel threads
  • t to turn off tree view
  • P to sort by CPU%
  • F2 → Display options → “Detailed CPU time” on. The CPU 3 bar then splits into system / IRQ / soft-IRQ / iowait, so you’ll see exactly which kind of kernel time it is.

You’ll most likely see a kworker/3:…, ksoftirqd/3, or irq/NN-… thread at the top.

Then confirm from the terminal

What is running on core 3 specifically:

sudo perf top -C 3

The top kernel symbols name the subsystem, for example i915/amdgpu (GPU), acpi_*, xhci (USB), iwlwifi, or nvme.

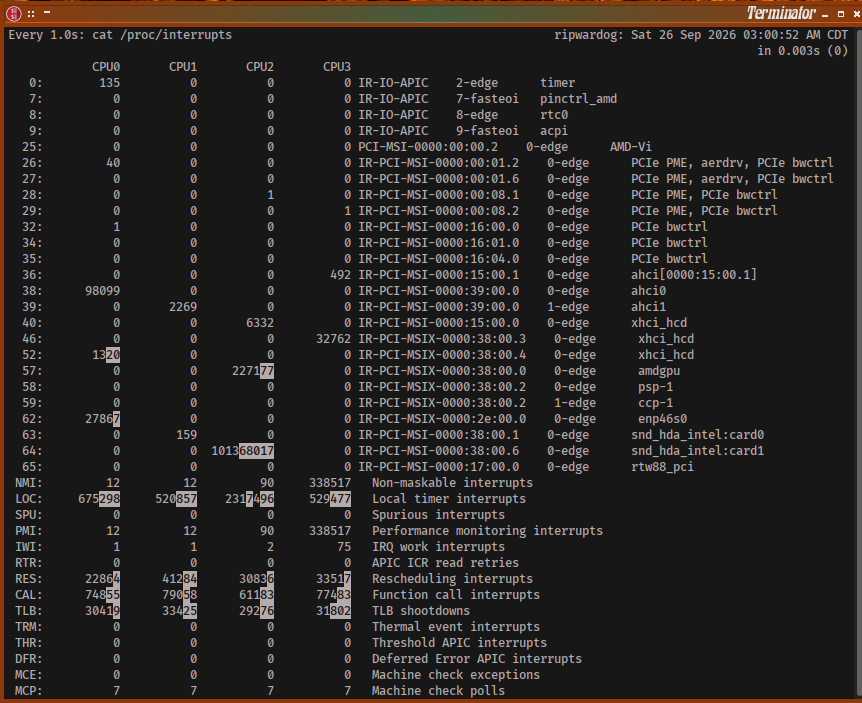
Is it an interrupt storm on CPU 3?

watch -d -n1 "cat /proc/interrupts"

Watch the CPU3 column for a counter that jumps by thousands per second. Do the same with /proc/softirqs.

If it’s ACPI (common on laptops):

grep . /sys/firmware/acpi/interrupts/gpe* | sort -t: -k2 -n | tail -5

A GPE with a huge, fast-growing count is the typical cause of one core stuck at around 30% kernel time. It can be disabled for testing with echo disable | sudo tee /sys/firmware/acpi/interrupts/gpeXX.

If you post what perf top -C 3 or the busy interrupt line shows, I can tell you which driver or setting to look at.

Can you show the output.

ps -eo pid,psr,pcpu,time,comm --sort=-time | head -10

ps: psr shows the last CPU core each process ran on

⤛ donald ⤜⤛ 05:54 ⤜⤛ ~ ⤜ps -eo pid,psr,pcpu,time,comm --sort=-time | head -10
error: conflicting format options

Usage:
 ps [options]

 Try 'ps --help <simple|list|output|threads|misc|all>'
  or 'ps --help <s|l|o|t|m|a>'
 for additional help text.

For more details see ps(1).


FWIIW I only noticed this after an update to lib32-openal occurred. It’s in the AUR and I failed to examine the pkg build before the upgrade. Might want to look into that. Also I did a timeshift back to before the upgrade, didn’t help.

I’ve since uninstalled it but it also didn’t seem to help.

I don’t know because archcanary says everything is clean.

Check summary
 ───────────────────────────────────────────────────────
 [1]  Package list (2479 pkgs)             ✅  clean
 [2]  pacman.log history                   ✅  clean
 [3]  Systemd persistence                  ✅  clean
 [4]  eBPF rootkit traces                  ✅  clean
 [5]  npm cache                            ✅  clean
 [6]  bun cache                            ✅  clean
 [6b] yarn cache                           ✅  clean
 [6c] pnpm cache                           ✅  clean
 [7]  PKGBUILD obfuscation scan            ✅  clean
 [8]  eBPF programs (bpftool)              ✅  clean
 [9]  ld.so.preload injection              ✅  clean
 [10] XDG autostart + shell RCs            ✅  clean
 [11] Kernel modules (DKMS)                ✅  clean
 [12] Lynis hardening                      ✅  clean
 [13] Package integrity                    ✅  clean
 ───────────────────────────────────────────────────────
============================================================
 RESULT: CLEAN - No indicators found.
============================================================


this is me. I don’t get the warning.

 ps -eo pid,psr,pcpu,time,comm --sort=-time | head -10
 ps -eo pid,psr,pcpu,time,comm --sort=-time | head -10
    PID PSR %CPU     TIME COMMAND
   2402   7  4.1 00:14:55 wireplumber
    920   8  3.1 00:11:08 Xorg
   2401  14  2.3 00:08:30 pipewire
1795539  16 36.6 00:07:49 stremio
   2642  10  2.1 00:07:43 picom
    856  12  1.8 00:06:40 pia-daemon
  97755   2  1.8 00:06:34 waterfox-bin
   2404  12  1.4 00:05:07 pipewire-pulse
   4208  13  1.2 00:04:36 xdg-desktop-por

Weird…
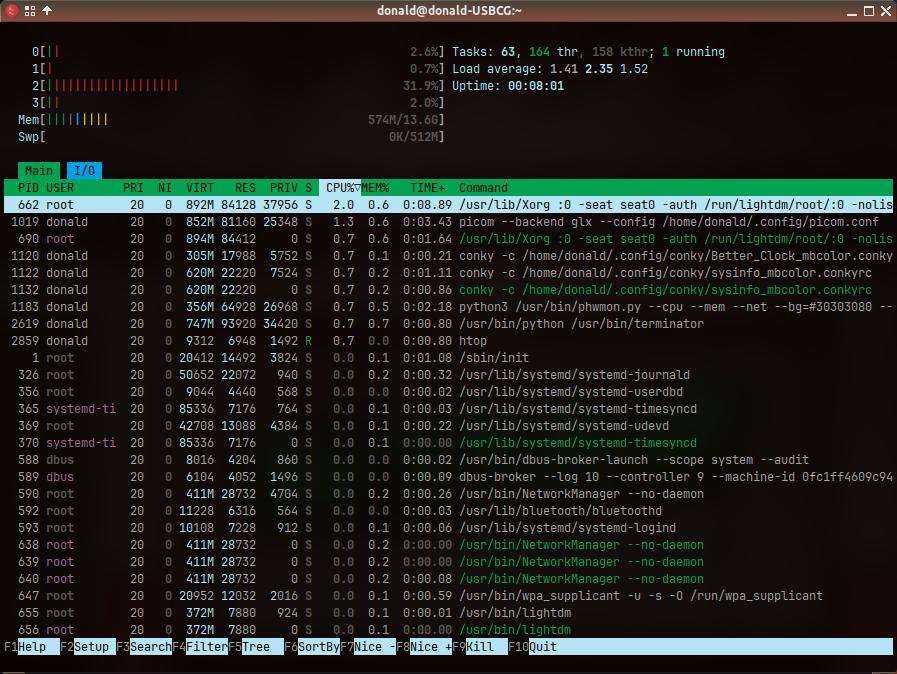
Anyway, as a test I booted to a fairly clean install that I keep on a USB drive, installed htop and took a look.

Seems I have the same issue on it. So… perhaps it’s ‘normal?’

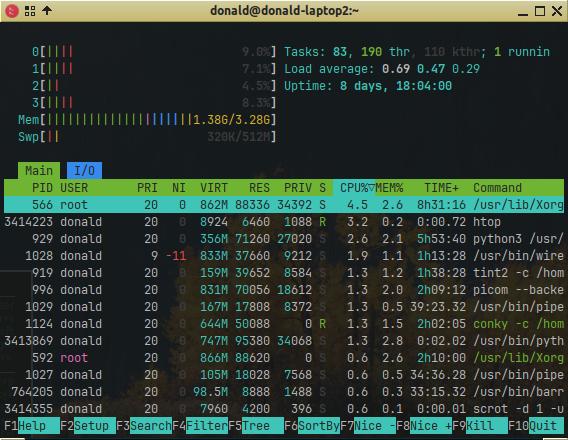
Cancel that. I did the same on one of my two laptop computers and it does NOT exhibit the same behavior…

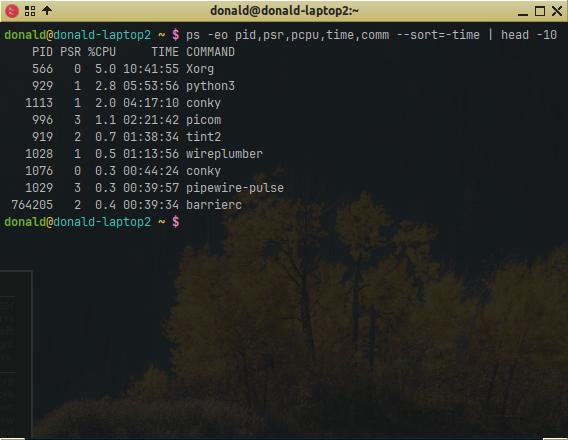
I definitely have something going on. executing the command:

ps -eo pid,psr,pcpu,time,comm --sort=-time | head -10

on my laptop works great.

Now I’m afraid I messed up the USB installation. :frowning: